Year
2022
Description
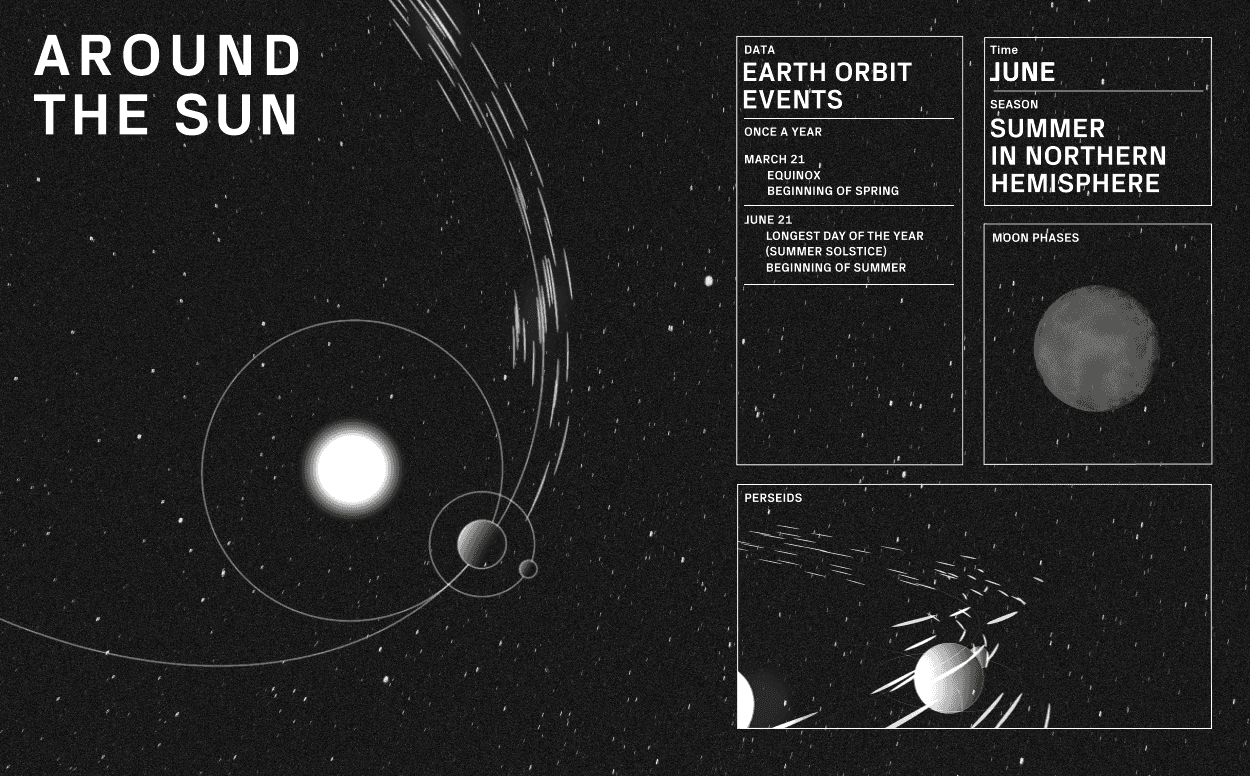
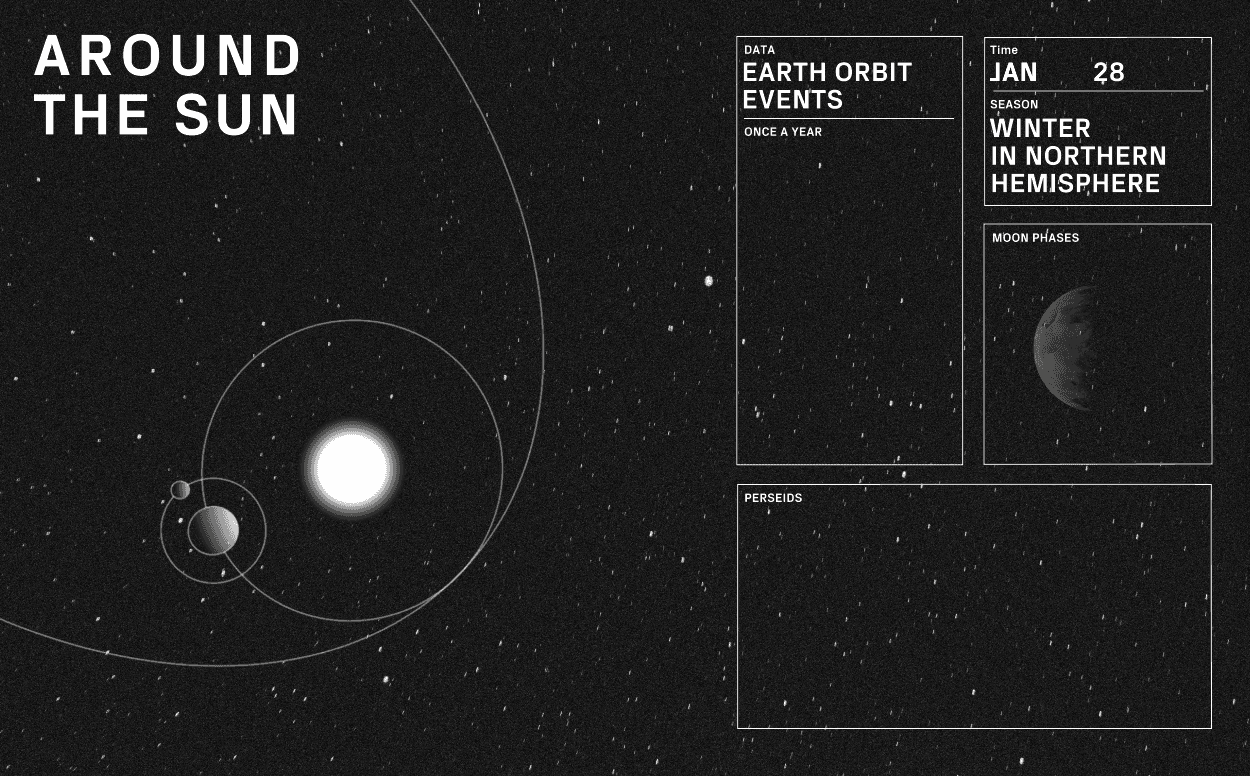
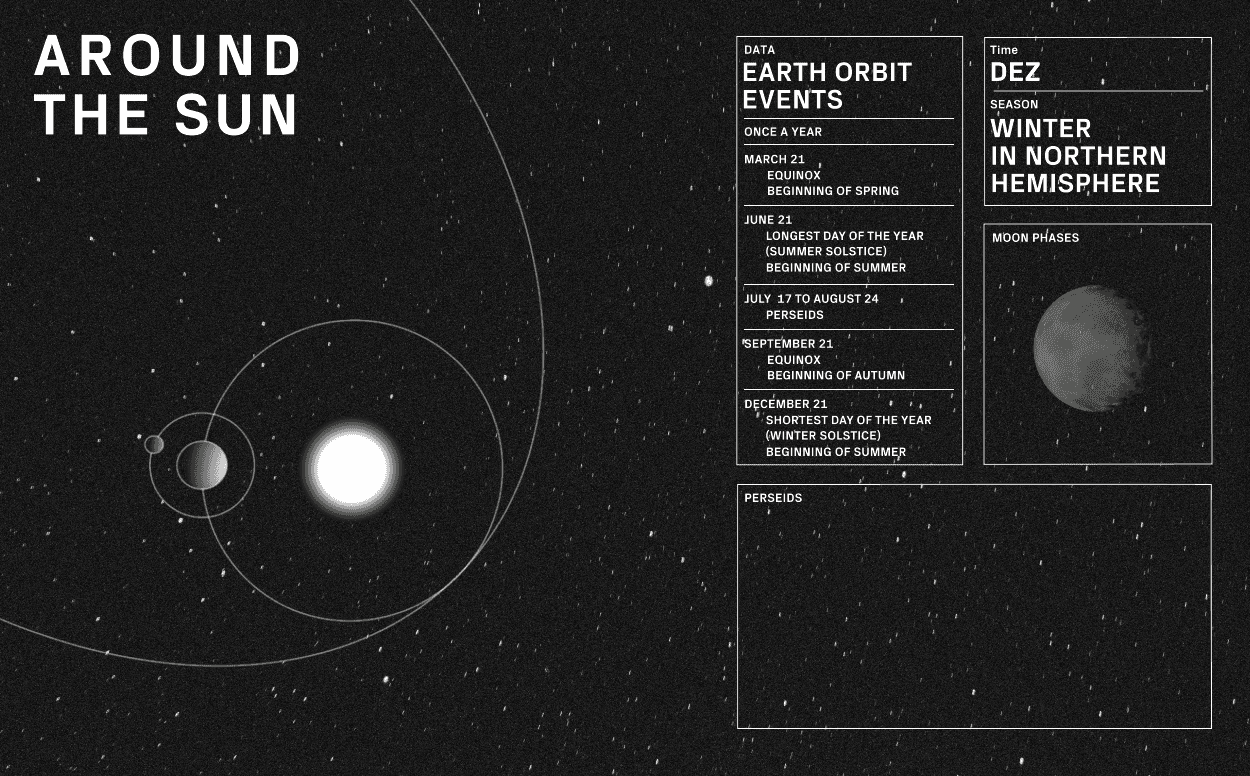
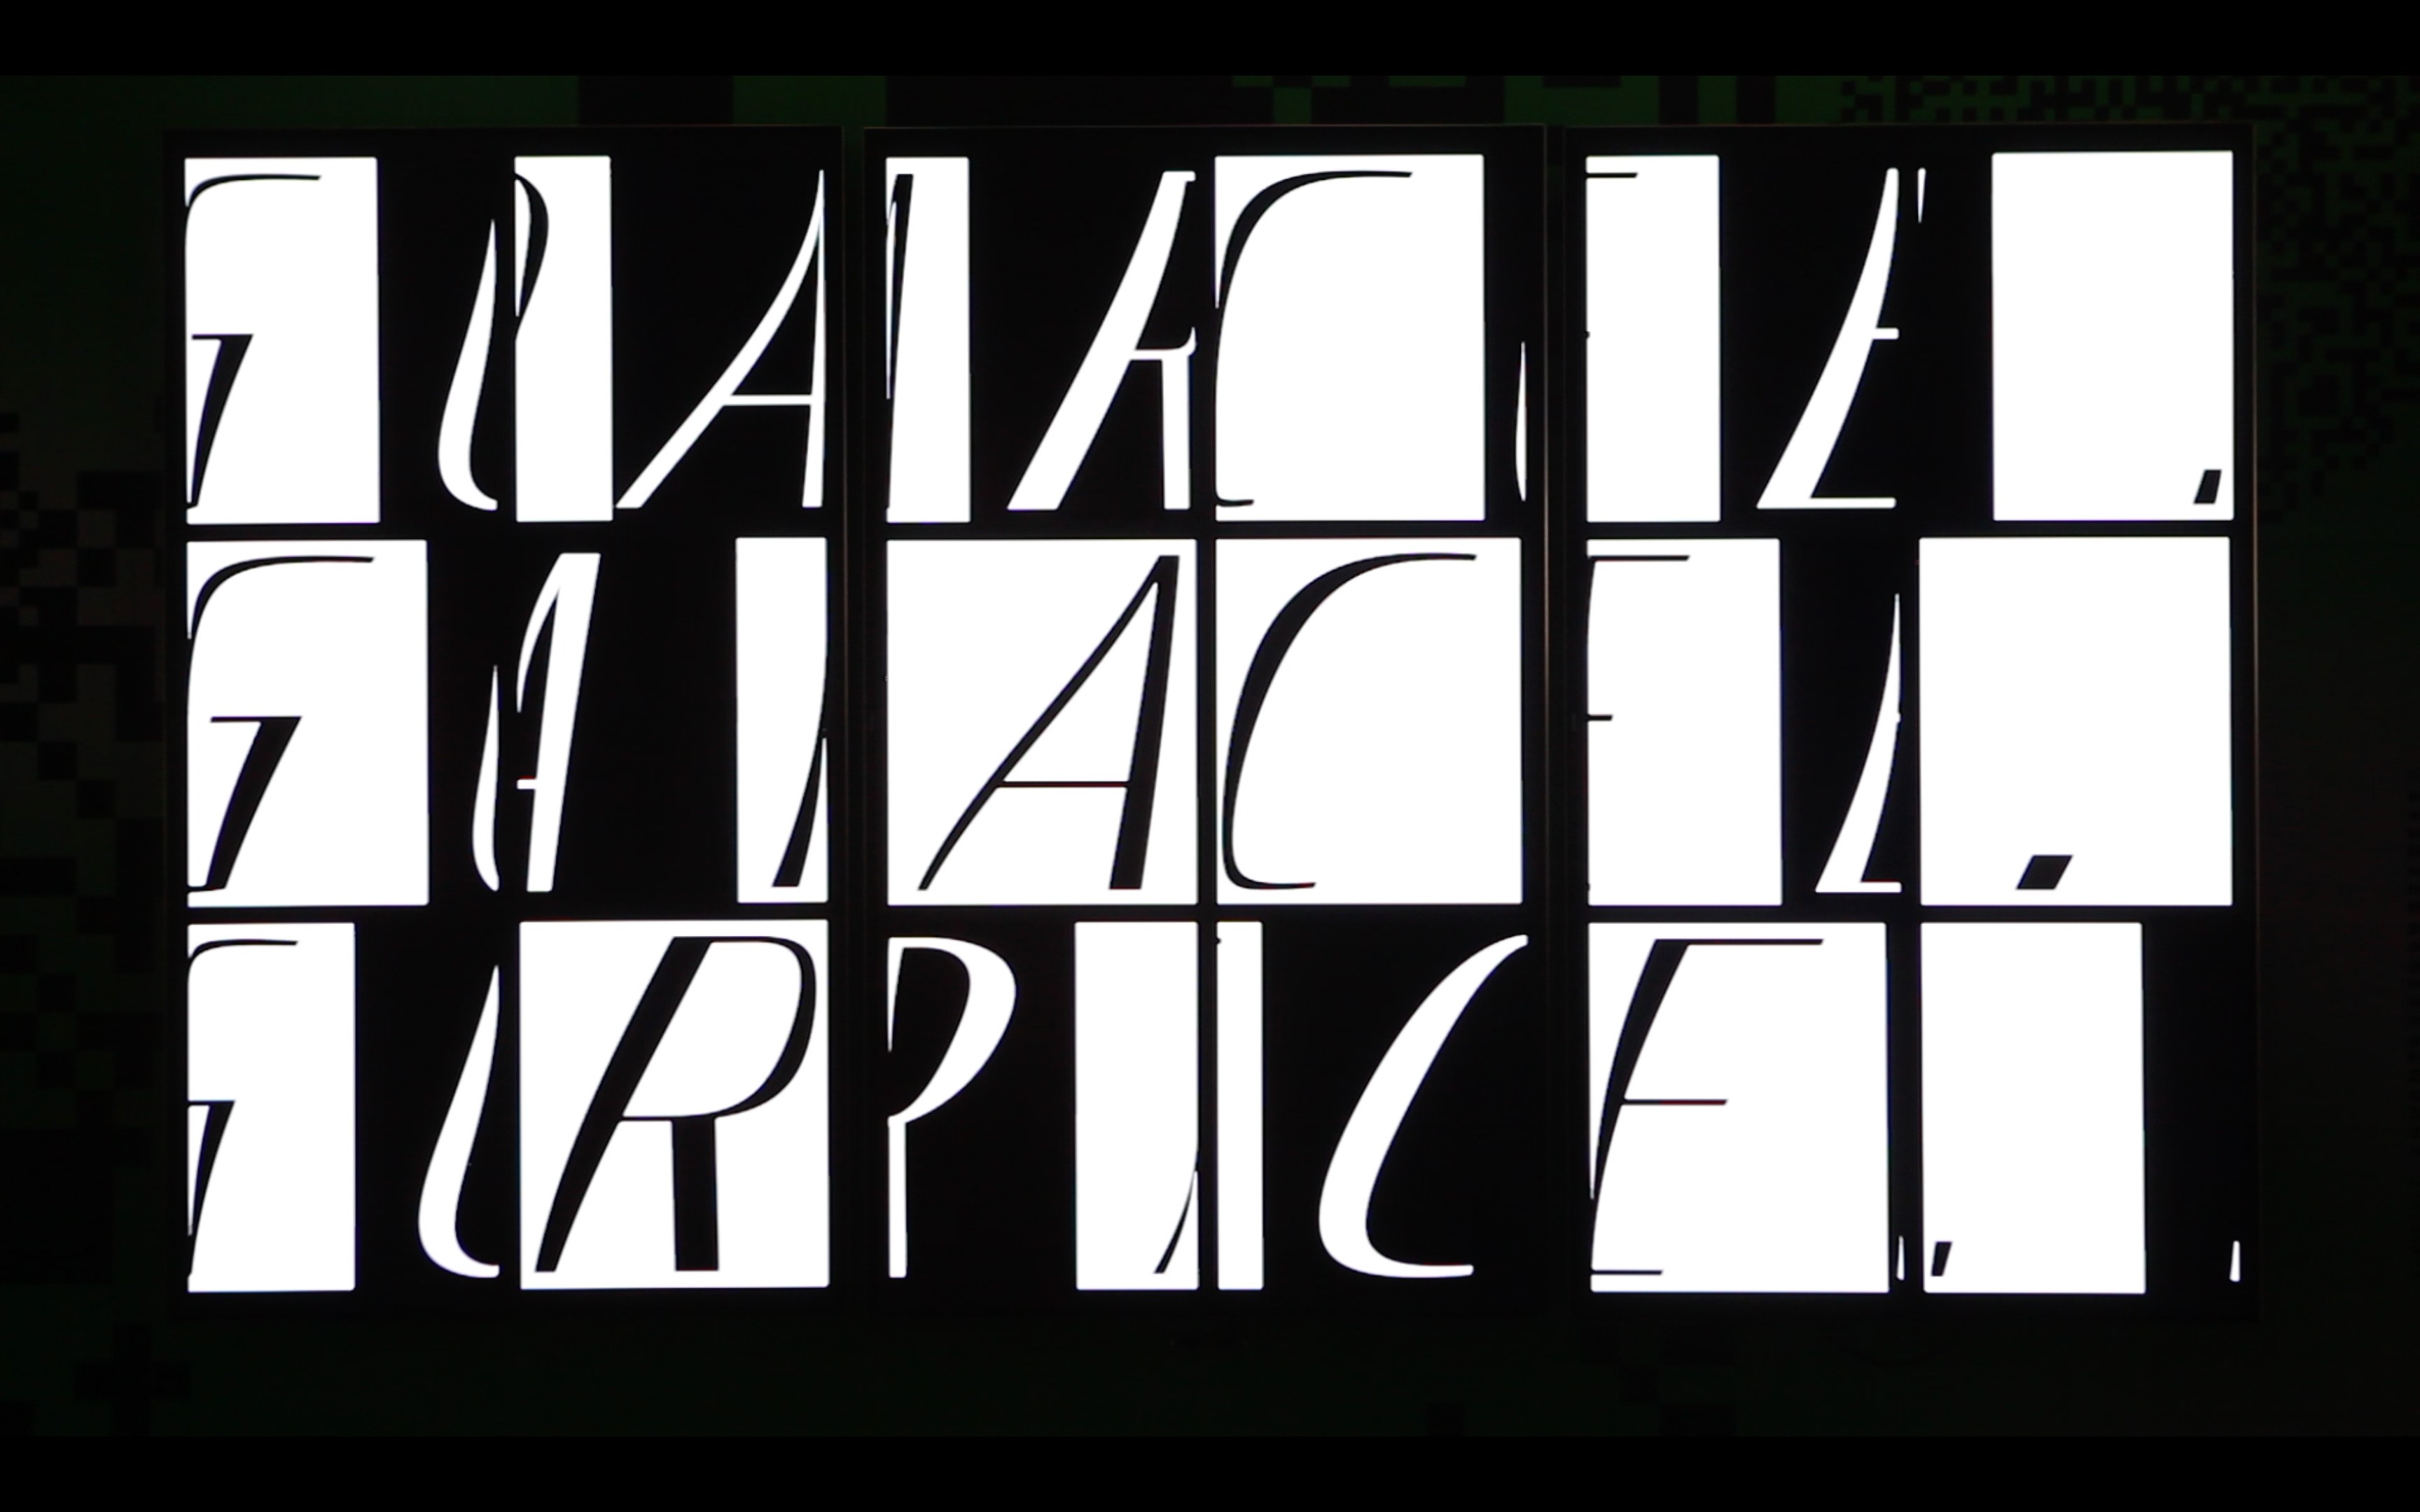
This animated infographic was created to display the Earth's annual trajectory, including moon phases and the Perseid meteor shower. The graphic highlights significant events and dates while illustrating the passage of time in the northern hemisphere. This project involved interdisciplinary collaboration with Knowledge Visualisation.
Services
Animated Infographic
My Contributions
✦ Conception of Visual Output ✦ Animation in After Effects
Collaboration
Joël Borter, Gabriel Schaller
